Momentum trading. Start.
Hello everyone. In October, I promised to make a formal Trading Strategy for our community called "Trinity". And so I wrote it: I collected screenshots of trading moments, drew various flowcharts with parameters for opening transactions, described specific trading situations and market conditions, and caught myself thinking that this may not be effective in terms of training members of our friendly community. Why? Yes, everything is very simple, our consciousness is arranged in such a way that when we see the finished information, we most often look at beautiful pictures and miss the text, or read it diagonally without absorbing the essence and nuances that may be there. It is inefficient and often useless. Therefore, I decided to write a series of training articles: starting from the very basics, I will tell you how I trade myself within the day, how I conduct analysis using this method of trading. The information is completely open, this is my personal experience and knowledge that I have gained from Lance Begs, Neil Fuller. But there is one small BUT: I want you to do the tasks that I ask and write comments with a link to the screenshots =) This will be something like free training with feedback from me. Neither in telegram nor in chat - only here. Sometimes I will go in and watch, make corrections. If you simply read this material, then most likely you will not learn this trading method. Those who want to learn will definitely learn =) So, let's go.
Momentum trading is the trading of the current wave of price movement, using the analysis of such parameters as: the strength of the initiators of the movement, the weakness of the restraining side, its momentum. This is my definition and it may not coincide with the opinion of Google =)
The trend.
We all know the phrase: the trend is your friend. This phrase is true as never before. Using this trading method, we trade exclusively with the trend. What is a trend? This is a directional price movement with constantly updated extremums. It seems like it could be easier at all?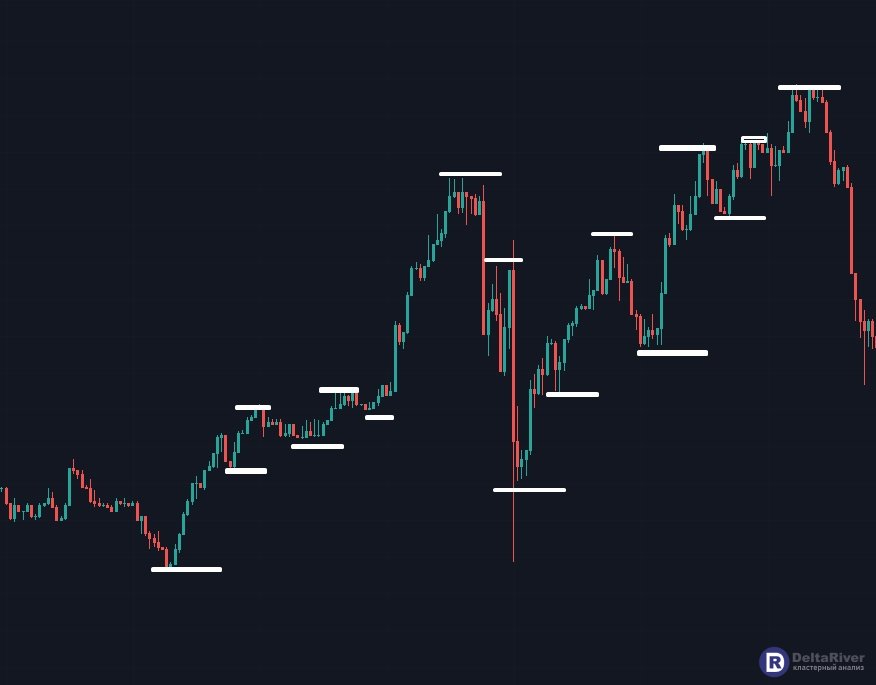
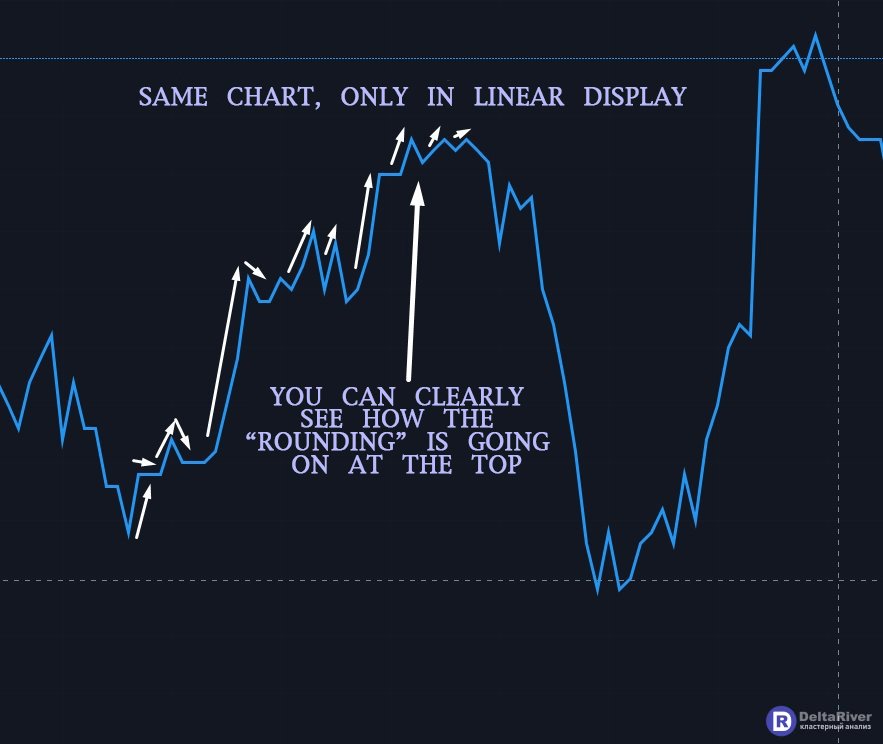
In the screenshot above, I gave an example of an uptrend: it is very clearly visible how the lows and highs increase relative to each other. I specifically did not choose the ideal image - there is also an impulse that can be taken as a reversal. We will learn how to determine this. But later. Now we are only interested in the trend. Above, I wrote about the initiators of the movement and the deterrent. Who is it? The initiator of the upward movement is the buyer, his deterrent is the seller. And vice versa for a downward movement (downward trend) - the seller will be the initiator of the movement, and the buyer will be its deterrent. By seller and buyer, I mean a certain "market mass" of market participants with a bullish or bearish mood. It is the result of the struggle of these "masses" that leads to a price movement. What characterizes the trend?
A trend is characterized by the strength or weakness of the initiators of the movement, as well as the strength or weakness of the restraining side. From these parameters we get - the momentum of movement. Let's get everything in order.
What signs of strength or weakness of buyers or sellers do we know? The answer will be: we can judge strength or weakness by volume and chart. We will judge by volumes a little later, today is the chart. So: power is expressed in shadows.
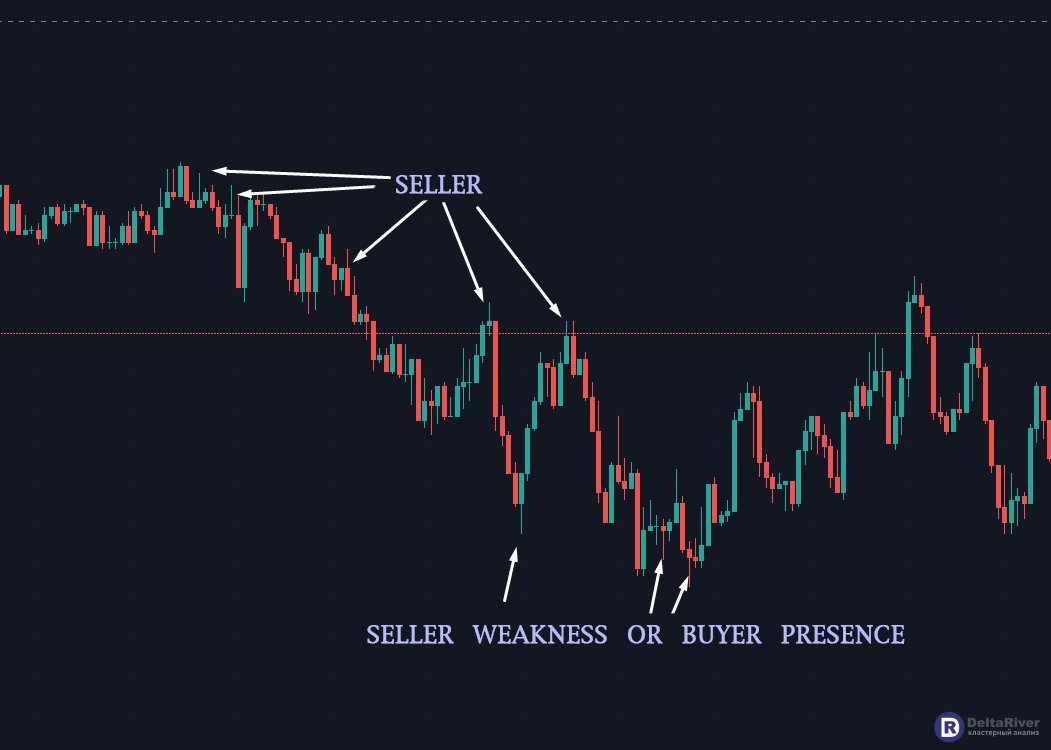
When moving up, the shadows from below tell us about the presence of the buyer’s strength, the shadows in the upper part indicate the presence of the seller, or signs of weakness of the buyer. When moving down, the shadows in the upper part indicate the presence of the seller, the shadows in the lower part indicate the weakness of the seller or the presence of the buyer. A few screenshots.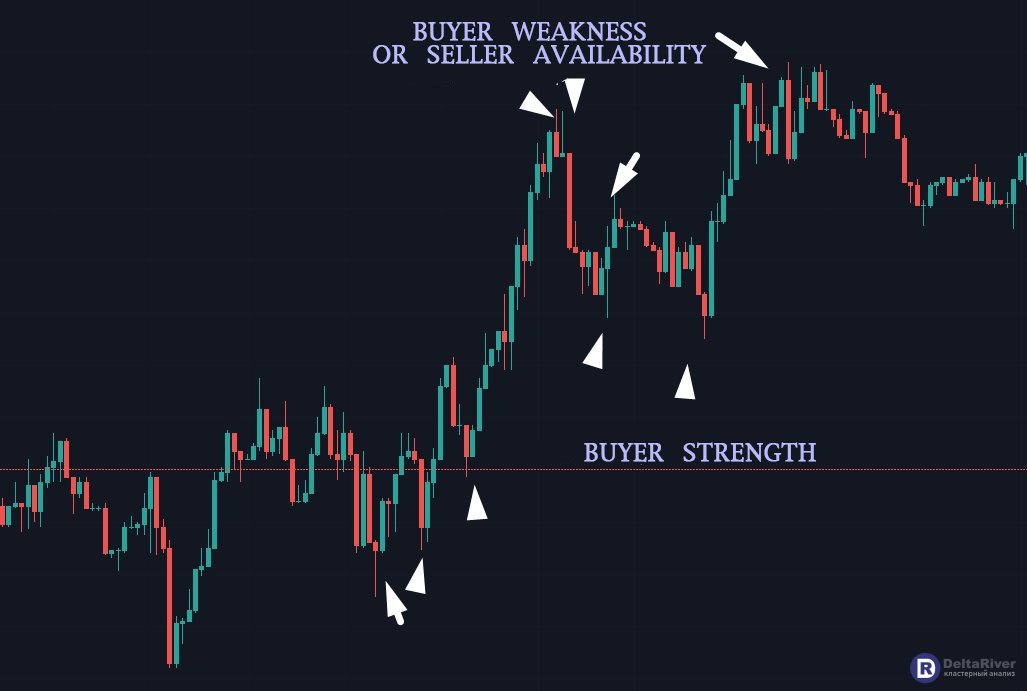
 The momentum of movement is the "speed" of price movement. The more points the price passes over a period of time, the stronger the momentum. The smaller the price passes over a period of time - the weaker the momentum. Momentum is a very subjective parameter and should only be used in comparison with previous waves of motion.
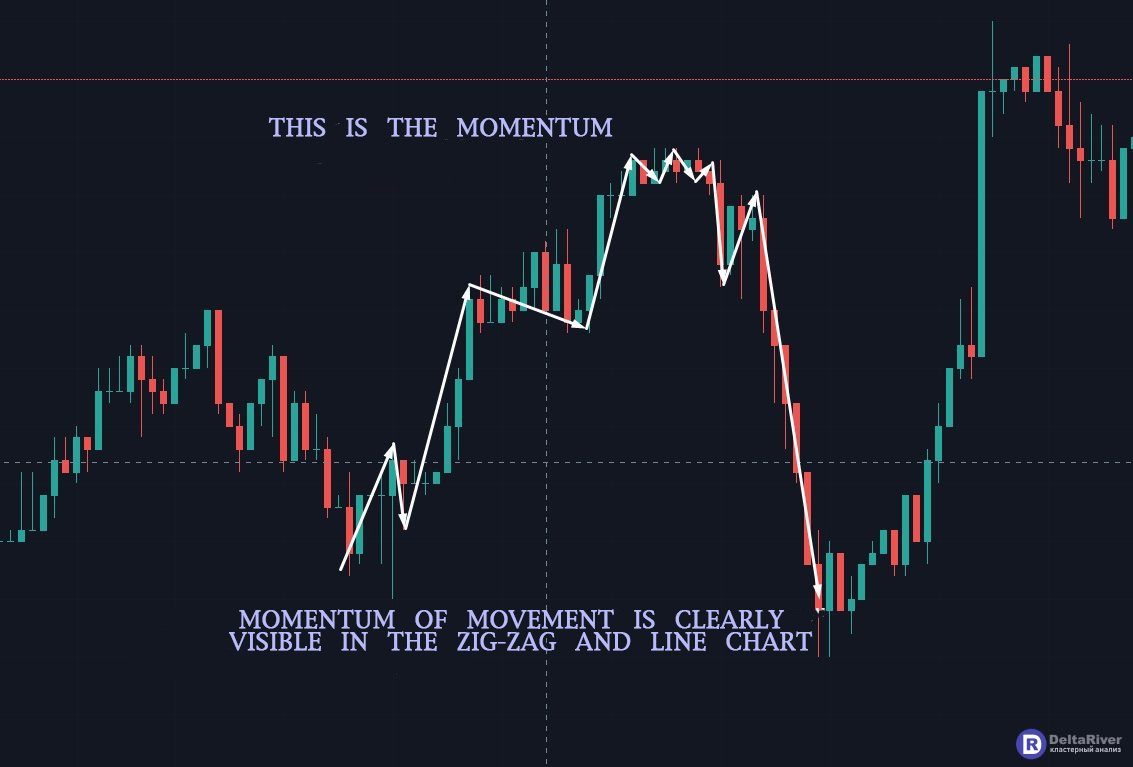
 In other words, the momentum shows us the "angle of attack" of the price movement.
Now you can say: "And we know that!". I agree with you if you write in the comments and prove it =)
And so, the task for those who want to learn something and is completely free and with feedback: write in the comments with links to screenshots of the candlestick chart, where there is a trend, while noting the update of the extremums, shadow (and explain whose shadow it is), and also show the momentum graphically. The more screenshots - the better. This is your practice. I repeat, reading articles without practice is not learning.
In conclusion, I want to say thank you for your time reading this article. I apologize in advance for possible errors in spelling and punctuation. This material is publicly available and it is a squeeze from the literature I studied, passed through the prism of my experience.
Комментариев 0