Momentum trading. Corrections.
Hello everyone! Today is the second article in which we will talk about CORRECTION. There will not be much water, only facts.
So what is correction? In simple words: this is a rollback against the trend. Why is it happening and why is it not a U-turn? We’ll talk about this.
For some reason, it is generally accepted that you need to trade a correction against the trend, a corrective rollback from the level, preferably with 3 knees, or overlappings, or a loss compensation system or the devil knows what else... You only need to trade with the trend! Short-term trend you are trading or medium-term, this is another conversation that relates to trading style and time periods, but it should be remembered that any trend in the lower timeframe can be just a correction for the older one... and so on... Does this mean that we need to trade the daily trend? Not a fact, if a trend on a lower timeframe has signs of a trend and strength, then we trade it, but only with the strength of this trend, given the range to the levels of a higher timeframe. But we take into account that if we trade a smaller timeframe, then the time periods will be small, this should be clear.
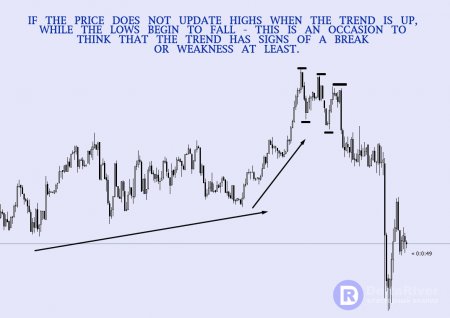
Trend breakdown. I will now show you a simple picture that should alert you to the issue of continuing the trend. If we see a similar picture - we do not immediately run to trade from the nearest level of support or resistance. Because we need strong trends.
So, summing up, without water, we consider the continuation of the trend for trading when:
1) There are no signs of breakage, as in the screenshot above
2) There is no accumulation or a small flat at the extremum from which the correction went
3) And the cherry on the cake: there is no aggression restraining the buyers or sellers...
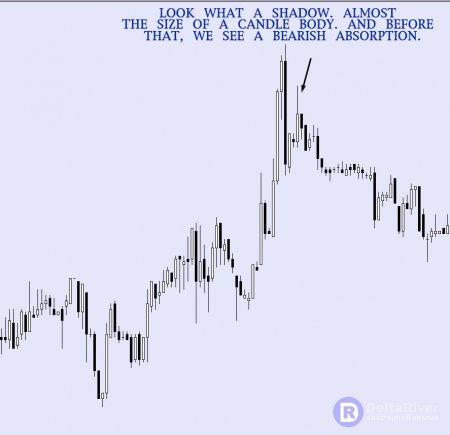
Let's take a closer look at point 3. In the screenshot above, you see a powerful reversal pattern, bearish absorption and shadow. This in its entirety is the aggression of the restraint. The restraining side for the upward trend is sellers, as we remember. The converse is true for the down trend. Shadows, absorptions, impulses against the trend - we are worried, we are watching if this trend has broken, and if we are out of work? Those who do not pay attention to this are out of the game. We will not. We know that. And do not forget that if there are levels of higher timeframes (both structural and volumetric) on the trend path, then we observe. In future articles I will describe the tactics of work.
Well, we have a trend, there is a corrective movement, the trend has not been broken (probably =)), what should we do? Where to get the price? Everything is simple. We go to the DeltaRiver terminal and adjust the correction levels in the Zoner indicator. I use the Trinity construction method - I just like it. You can take any other. When constructing correction levels using the Trinity method, the following levels of correction are most interesting to me: 30%, 50%, 70%. A correction level of 50% I call the "last line of trend defense". We are all simple, there are no beautiful and complex terms, we call all things by their proper names. A level of 30% is a correction level for a downtrend, a level of 70% is a correction level for an uptrend, and 50% is universal =).


 In the screenshots above you saw some moments of working out the levels. In the next article, we will begin to study cluster and vertical volumes. I draw your attention - the presence of a correction level, like any other level, is not a reason to enter into a transaction without confirmation. Homework: just “walk” through the history on the chart in DeltaRiver and pull the Zoner indicator along the trend movements. Throw your screenshots in the comments.
Here is such a simple article, but keep in mind - do not relax, serious information will come next.
Have a good weekend =)

Комментариев 0